I downloaded population density data form Our World in Data. I selected this data because i am interested in how our planet, and its people.
This is the link to the data.
The following code chunk loads the package iw ill use to read in and prepare the data for analysis.
- Read the data in
- Use glimpse to see the names and types of the columns
glimpse(population_density)
Rows: 69,379
Columns: 4
$ Entity             <chr> "Afghanistan", "Afghanistan", "Afghanista~
$ Code               <chr> "AFG", "AFG", "AFG", "AFG", "AFG", "AFG",~
$ Year               <dbl> -10000, -9000, -8000, -7000, -6000, -5000~
$ population_density <dbl> 0.023, 0.031, 0.043, 0.060, 0.083, 0.115,~view(population_density)
- Use output from glimpse (and view) to prepare the data for analysis
create the object
regionsthat is list of regions i want to extract from the data setChange the name of 1st column to region and the 4th column to PD.
Use filter to extract USA 1950-1960
select the columns to keep: Region, Year, PD
regions <- c( "USA" )
population_density <- population_density %>%
  rename(Region = 1, PD = 4) %>%
  filter(Year == 2000) %>%
  select(Region, Year, PD)
population_density
# A tibble: 218 x 3
   Region               Year    PD
   <chr>               <dbl> <dbl>
 1 Afghanistan          2000  31.8
 2 Albania              2000 114.
 3 Algeria              2000  13.0
 4 American Samoa       2000 289.
 5 Andorra              2000 139.
 6 Angola               2000  13.2
 7 Antigua and Barbuda  2000 173.
 8 Argentina            2000  13.5
 9 Armenia              2000 108.
10 Aruba                2000 505.
# ... with 208 more rows
check that the total population density equals the total in the graph
# A tibble: 218 x 3
   Region               Year    PD
   <chr>               <dbl> <dbl>
 1 Afghanistan          2000  31.8
 2 Albania              2000 114.
 3 Algeria              2000  13.0
 4 American Samoa       2000 289.
 5 Andorra              2000 139.
 6 Angola               2000  13.2
 7 Antigua and Barbuda  2000 173.
 8 Argentina            2000  13.5
 9 Armenia              2000 108.
10 Aruba                2000 505.
# ... with 208 more rows
Add a picture 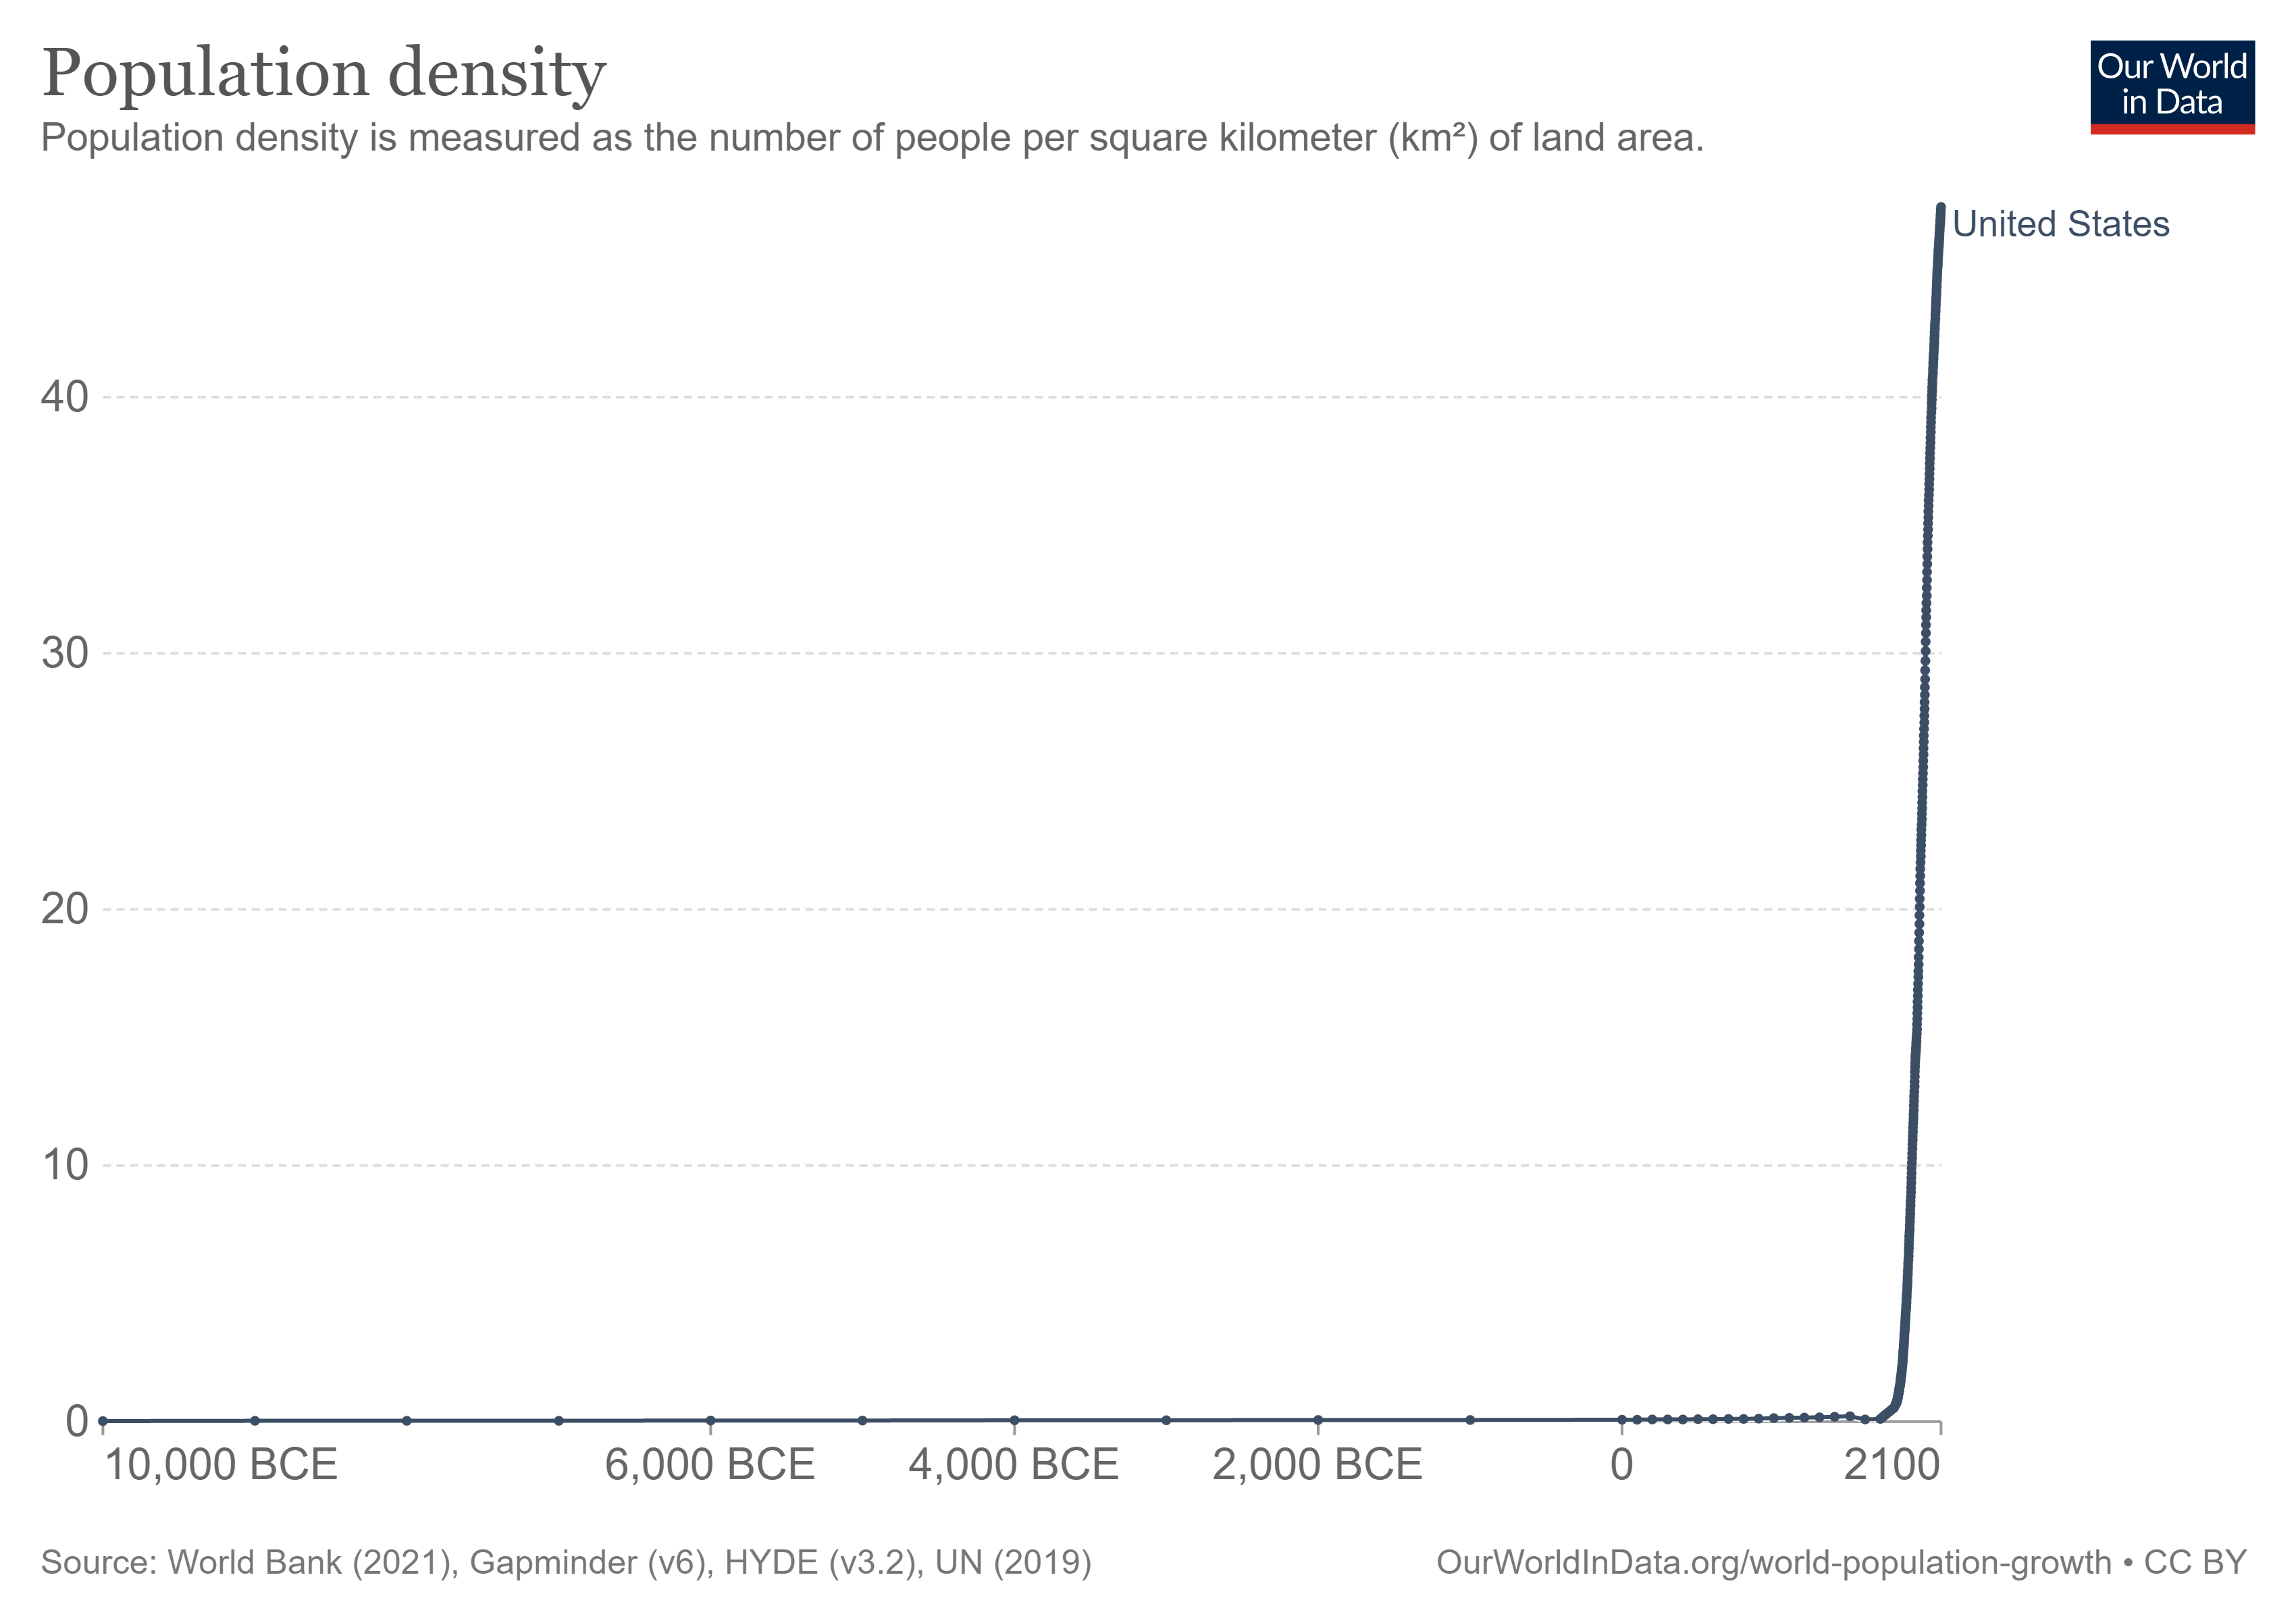
Write the data to file in the project directory
write_csv(population_density, file = "population_density.csv")